Lowest Cap Rate
5.19%
Lowest Cap Rate over past 24 months
Average Cap Rate
5.67%
12 mo avg with 3+ yr lease term
Average Cap Rate calculated if 3+ comps are available over past 12 months
Quarter Cap Rate
5.58%
Average Cap Rate over previous quarter
Average Quarter Cap Rates calculated over prior full quarter, irrespective of term length
Overview
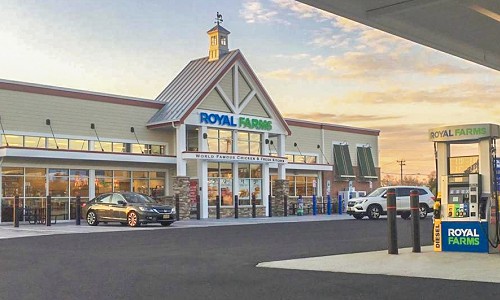
With some of the best real estate locations, Royal Farms has been able to break into the “one stop shop” convenience store industry. While typically such competitors offer easy and quick sandwiches to make, Royal Farms has mastered their signature Fried Chicken. With this diversity in the industry, Royal Farms has been able to expand quickly. Royal Farms have over 205 locations in Maryland, Delaware, Pennsylvania, Virginia, and New Jersey and quickly continuing to grow. Royal Farms offers 20-year NNN leases with escalations built in at a rate of 10% every 5-10 years.
Property & Lease
Sales Price Range$4,000,000 - $6,000,000
NOI Range$200,000 - $325,000
Building SF4,000
Lease Term20 Years
Escalations10% Every 5-10 Years
Stock SymbolCAPITALCOM:US500
Credit Rating
S&PN/A
Moody'sN/A
Cap Rate By Region
Average regional cap rates calculated over past 24 months, irrespective of term length
5.27
5.72
N/A
N/A
N/A
N/A
*Regional cap rates calculated from sales data available over the past 24 months, irrespective of remaining term.
Financial Fundamentals
- Overview
- Cap Rate By Region
Recent Sales Comps
Norfolk, VA5.58%
Temple Hills, MD6.00%
Bedford, VA5.19%
Top Consumer Traffic
Columbia, MD1,200,000
Gaithersburg, MD1,100,000
Parkton, MD1,099,999
Provided by Placer.ai
*Indicates ranking may be skewed due to limited data

