Lowest Cap Rate
3.75%
Lowest Cap Rate over past 24 months
Average Cap Rate
4.48%
12 mo avg with 5+ yr lease term
Average Cap Rate calculated if 3+ comps are available over past 12 months
Quarter Cap Rate
4.38%
Average Cap Rate over previous quarter
Average Quarter Cap Rates calculated over prior full quarter, irrespective of term length
Overview
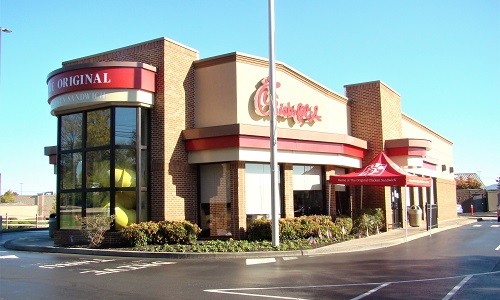
Headquartered in Atlanta, Georgia, Chick-fil-A has surged to become the third largest fast-food chain in the U.S bringing in sales of $11.3 billion in 2019, thanks to their world-famous Chicken Sandwich. With over 2,600 locations, Chick-fil-A has also just been voted the favorite fast-food restaurant of Gen Z. Chick-fil-A in 2019 reported that its average annual unit sales was $4.7 million, whereas the standalone locations not in the malls did sales around $6.5 million. Chick-fil-A locations are hard to come by and are always in high demand. Chick-fil-A generally offers 15-year leases with rental escalations of 10% every 5 years.
Property & Lease
Sales Price Range$3,000,000 - $4,500,000
NOI Range$125,000 - $175,000
Building SF4,200
Lease Term15 Years
Escalations10% Every 5 Years
Stock SymbolCAPITALCOM:US500
Credit Rating
S&PN/A
Moody'sN/A
Cap Rate By Region
Average regional cap rates calculated over past 24 months, irrespective of term length
4.58
4.11
4.56
4.12
3.62
3.82
*Regional cap rates calculated from sales data available over the past 24 months, irrespective of remaining term.
Financial Fundamentals
- Overview
- Cap Rate By Region
Recent Sales Comps
Brandon, FL4.00%
Decatur, GA4.25%
Birmingham, AL4.77%
Top Consumer Traffic
Woburn, MA1,800,000
Salinas, CA1,700,000
Lancaster, PA1,700,000
Provided by Placer.ai
*Indicates ranking may be skewed due to limited data

