Lowest Cap Rate
4.27%
Lowest Cap Rate over past 24 months
Average Cap Rate
5.81%
12 mo avg with 5+ yr lease term
Average Cap Rate calculated if 3+ comps are available over past 12 months
Quarter Cap Rate
6.51%
Average Cap Rate over previous quarter
Average Quarter Cap Rates calculated over prior full quarter, irrespective of term length
Overview
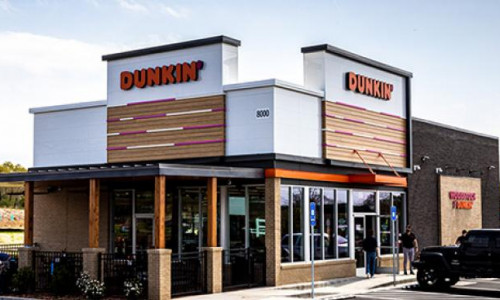
Dunkin’ is the world's leader in baked goods and coffee chains. Typically located in high foot traffic areas, Dunkin’ serves more than 3 million people per day. As of 2019, Dunkin' has over 12,000 locations in 41 states across the U.S. Investors can anticipate an average lease term of 15-20 years with escalations of 8%-10% every 5 years on the base term. Dunkin’ is also showing average sales per store of just over one million a year. As a leader in the quick service sector Dunkin’ is projected to be a viable investment for years to come.
Property & Lease
Sales Price Range$1,100,000 - $1,750,000
NOI Range$60,000 - $125,000
Building SF2,000
Lease Term15-20 Years
Escalations8% - 10% Every 5 Years
Stock SymbolCAPITALCOM:US500
Credit Rating
S&PB+
Moody'sB2
Cap Rate By Region
Average regional cap rates calculated over past 24 months, irrespective of term length
5.51
5.22
5.75
5.54
N/A
N/A
*Regional cap rates calculated from sales data available over the past 24 months, irrespective of remaining term.
Financial Fundamentals
- Overview
- Cap Rate By Region
Recent Sales Comps
Goldsboro, NC5.75%
Chattanooga, TN5.15%
Blacksburg, VA6.46%
Top Consumer Traffic
Fletcher, NC865,900
Munster, IN767,300
Philadelphia, PA759,700
Provided by Placer.ai
*Indicates ranking may be skewed due to limited data

